The minimal working example (creation of dataset + simple plot) is given below.
import
matplotlib.pyplot as plt
import
numpy as np
x =
np.arange(0,20.01,0.01)
y =
np.sin(x)
plt.figure()
plt.plot(x,y)
plt.xlabel("$x$")
plt.ylabel("$sin(x)$")
plt.xlim(0,20.0)
plt.ylim(-1.5,1.5)
plt.show()
After
typing and running this code the following diagram is obtained.
Figure 1 – Result of minimal working example
without the grid.
As seen
from previous figure the diagram does not contain grid. To include grid just
type in the following command before plt.show() command.
plt.grid(True)
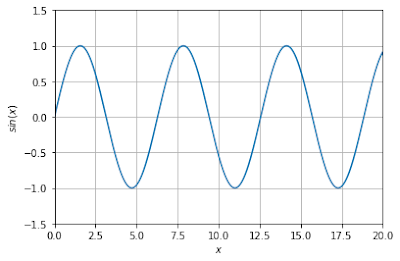
When the
entire code is executed the following diagram is obtained.
Figure 2 – Result of minimal working example
with plt.grid(True) command included.
The entire code of minimal working example
is given below.
import
matplotlib.pyplot as plt
import
numpy as np
x =
np.arange(0,20.01,0.01)
y =
np.sin(x)
plt.figure()
plt.plot(x,y)
plt.xlabel("$x$")
plt.ylabel("$sin(x)$")
plt.xlim(0,20.0)
plt.ylim(-1.5,1.5)
plt.grid(True)
plt.show()


Nema komentara:
Objavi komentar